
FT Partners Quarterly Crypto & Capital Markets Tech Insights and Annual Almanac
FT Partners is the only data source for comprehensive, global Crypto & Blockchain and Wealth & Capital Markets Tech deal activity covering M&A, Financing and IPO statistics and trends
FT Partners’ Crypto & Capital Markets Tech Insights Reports are published on a quarterly basis, along with a comprehensive year-end Almanac. All information included in the reports is sourced from FT Partners’ Proprietary Transaction Database, which is compiled by the FT Partners Research Team through primary research and data analysis. The reports feature M&A, financing and IPO statistics and trends as well as breakdowns by vertical, geography, investor-type and much more.
View our Global FinTech Insights and Almanac reports here.
Be sure to check back for quarterly updates and additions. All recent reports can be viewed or downloaded for free below.
2023 Crypto & Capital Markets Tech Almanac
Key Highlights:
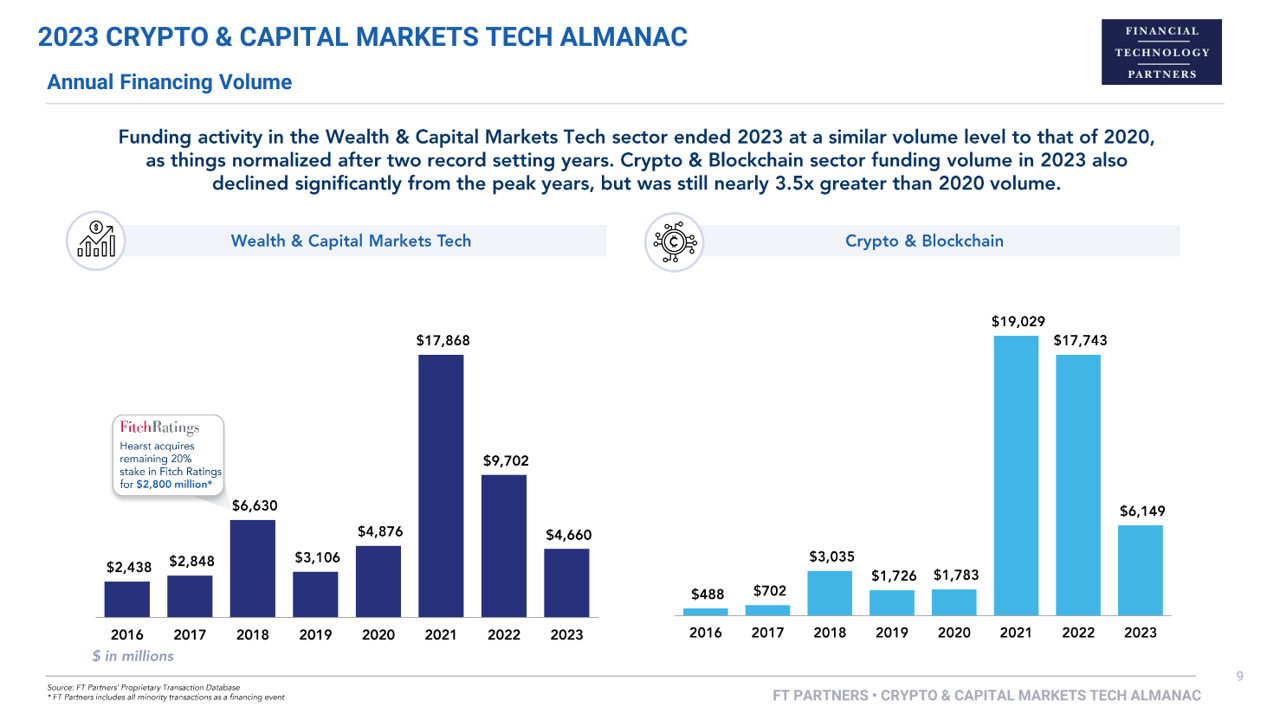
- Total private company funding volume for the Wealth & Capital Markets Tech sector fell 52% year-over-year in 2023, totaling $4.7 billion, a similar level to that of 2020 which recorded $4.9 billion.
- Similar to the broader FinTech market, funding levels for the sector largely normalized during the year, after the soaring highs experienced in 2021 and 2022.
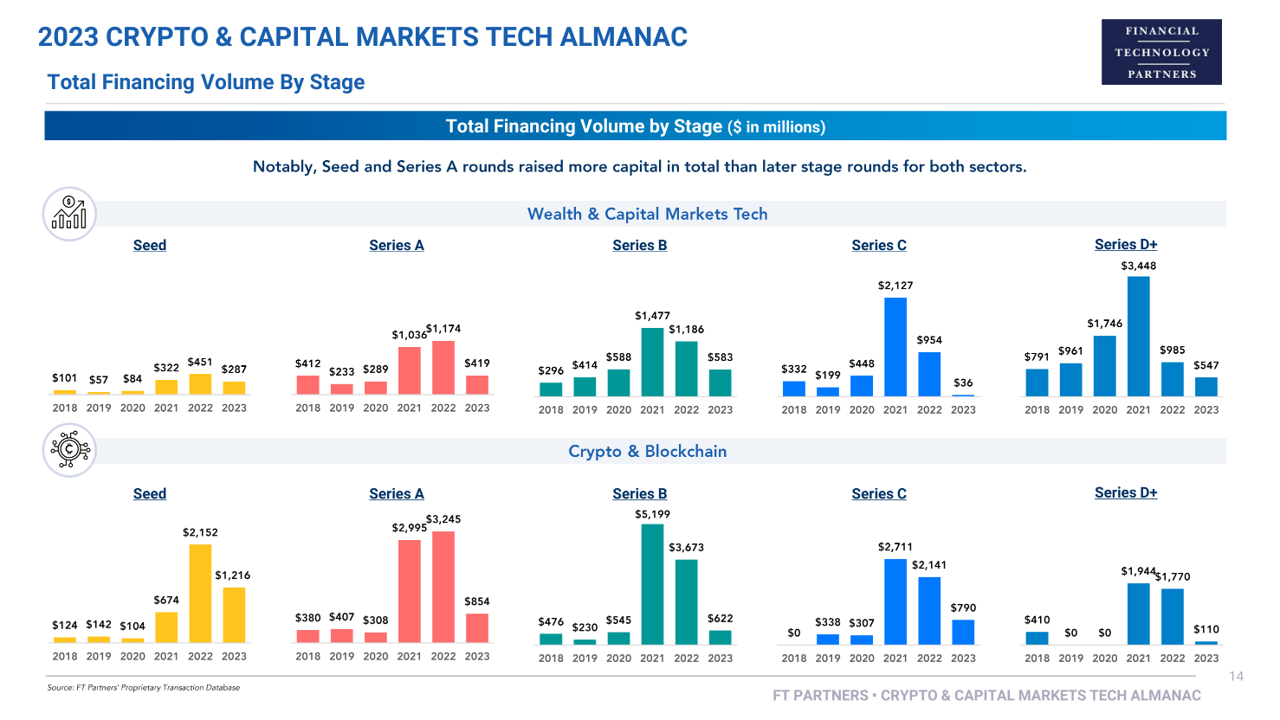
- Financing activity was largely driven by early-stage deals, with more capital going to Seed and Series A rounds ($706 million) than Series C+ ($583 million).
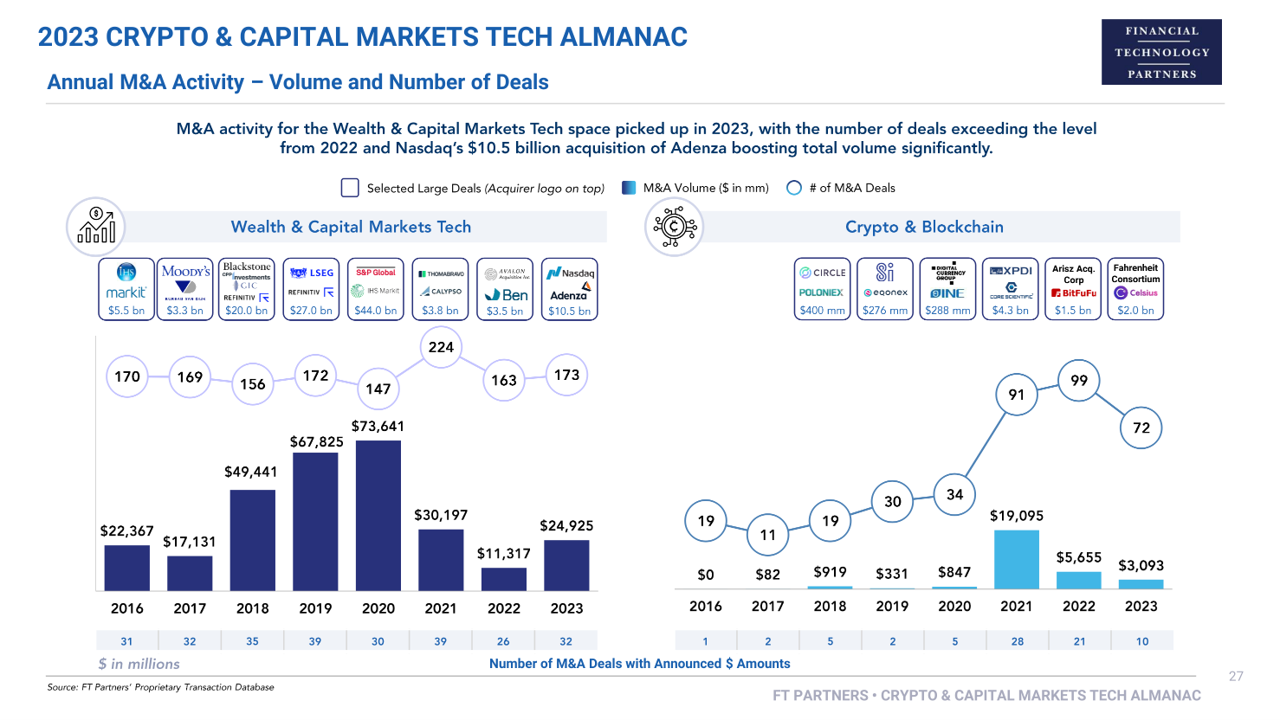
- M&A activity for the sector increased year-over-year in 2023 in terms of total announced dollar volume and deal count, with volume boosted by five $1 billion+ transactions, the largest being Nasdaq’s $10.5 billion acquisition of Adenza.
Wealth & Capital Markets Tech
- Crypto & Blockchain funding volume of $6.1 billion in 2023 declined 65% year-over-year and 68% from the peak of activity in 2021. Still, volume was nearly 3.5x higher than that of 2020 and ranked as the third largest volume year.
- Financing deal count for the sector in 2023 notably exceeded the level from 2021 reaching 684 capital raises, though the count did decline 23% from 2022.
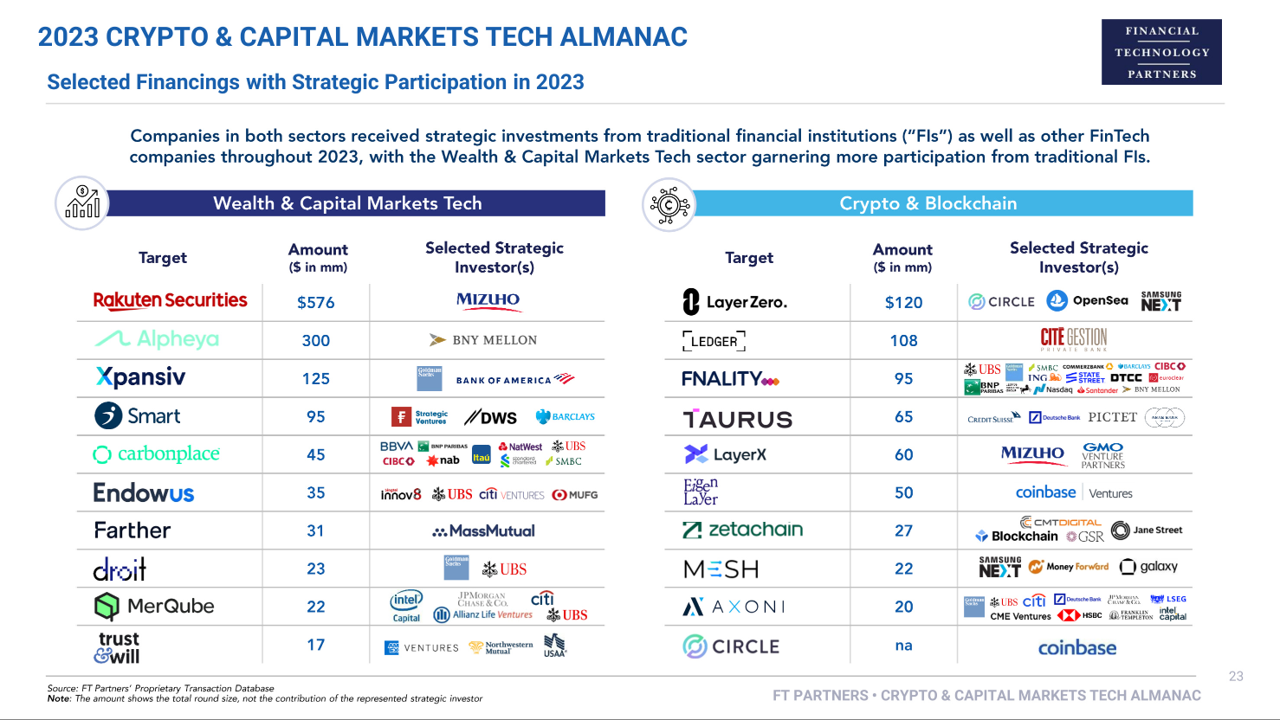
- 57% of Crypto & Blockchain financings in 2023 included participation from at least one strategic investor – the highest ratio of any FinTech sector. Both established crypto companies and traditional FIs were amongst the active strategic investors in the space.
Crypto & Blockchain
Report Features:
- 2023 and historical Crypto & Blockchain and Wealth & Capital Markets Tech financing and M&A volume and deal count statistics
- Largest financings and M&A transactions in 2023
- Most active investors across both sectors
- Corporate VC activity and strategic investor participation
- Market performance data, IPO and SPAC volumes, and crypto prices and volumes
View Prior Reports